Agency KPI Calculator

Agency KPI Calculator

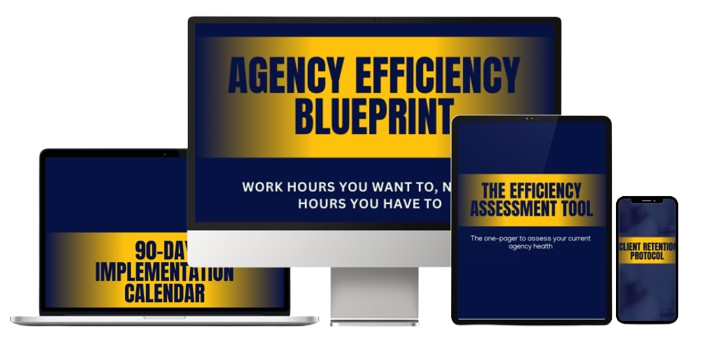
Measure What Matters & Quantify Your Improvement Opportunities

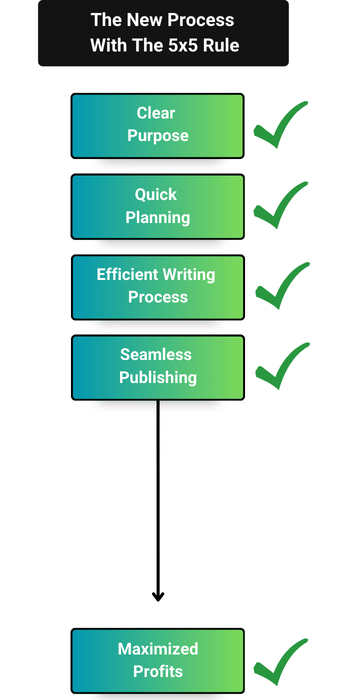
A structured framework for identifying, measuring, and optimizing the metrics that truly matter for agency success.

By using this calculator, you'll gain clarity on:
  • How much money is leaking from agency operations
  • Which improvements will create the biggest financial impact
  • How your performance compares to industry benchmarks
  • The specific financial value of operational improvements
1. Client Retention & Value Metrics

Input Variables

Industry Avg: 76%  |  Top 25%: 85%+
Industry Avg: 14  |  Top 25%: 24+

Calculated KPIs

$0 Client Lifetime Value
0% Annual Churn Rate
0 Clients Lost Annually
$0 Annual Value at Risk
$0 5% Retention Impr. Value
Retention Value Visualization

Key Insights & Recommendations

  • Each 5% improvement in retention creates significant annual revenue.
  • Reducing client churn should be a top priority.
  • Compare your client lifetime value to top-performing agencies for focus.
  • Implementing Client Retention Protocol can dramatically raise profitability.
2. Project Profitability Metrics

Input Variables

Industry Avg: 15%  |  Top 25%: 5%

Calculated KPIs

0% Project Profit Margin
$0 Overrun Cost Per Project
$0 Monthly Overrun Loss
$0 Potential Annual Savings
Project Profitability Visualization

Key Insights & Recommendations

  • Current overrun rate can cost significant annual profits.
  • Reducing overrun to the benchmark 5% saves substantial money.
  • Strong profit margin, but overruns are eroding potential profits.
  • Implement the Project Delivery Framework to control overruns substantially.
3. Team Utilization Metrics

Input Variables

Industry Avg: 68%  |  Top 25%: 75%+
Industry Avg: 80%  |  Top 25%: 85%

Calculated KPIs

$0 Monthly Revenue per Member
$0 Monthly Rev. Gain (to Target)
$0 Annual Rev. Opportunity
0 Team Billable Hours (monthly addnl)
Utilization Visualization

Key Insights & Recommendations

  • Increasing utilization has the biggest impact on annual revenues.
  • Each 5% improvement can be worth six figures per year.
  • Benchmark against industry leaders to identify your opportunity.
  • Implement the Team Accountability Framework for rapid improvements.
4. Delivery Efficiency Metrics

Input Variables

Industry Avg: 72%  |  Top 25%: 85%+
Industry Avg: 3.5  |  Top 25%: 2.0
Industry Avg: 2.0  |  Top 25%: 1.5

Calculated KPIs

0% Delivery Efficiency Rating
0 Monthly Hrs. Lost to Revisions
$0 Monthly Revenue Impact
$0 Annual Revenue Impact
Delivery Efficiency Visualization

Key Insights & Recommendations

  • Excess revisions cost substantial revenue in billable time.
  • Pursue benchmark delivery rates for major efficiency gains.
  • Improve on-time delivery to dramatically increase effectiveness and value.
  • Implement Quality Control and Project Delivery systems for best results.
5. Agency Health Summary
7.5/10 Client Health
8.2/10 Profitability
5.8/10 Delivery Health
7.2/10 Overall Health
Improvement Area Annual Value
5% Client Retention Improvement$0
Reducing Overruns to 5%$0
Improving Utilization to Target$0
Reducing Excess Revisions$0
TOTAL ANNUAL OPPORTUNITY$0
How to Use This Calculator
  1. Gather your agency's current metrics and enter them in each section honestly.
  2. Review the calculated KPIs and visualizations for each performance area.
  3. Compare your performance to industry averages and top agencies highlighted.
  4. Prioritize improvements by biggest financial impact (see summary above).
  5. Set measurable targets and track monthly progress using this template.
  6. Use your opportunity analysis to guide implementation and maximize ROI.

© Hafsa | Agency Efficiency Blueprint

Hey! Don't Go Without Your Templates

This is a very limited time offer that will expire by 30th July 2024

ONLY $4.97 Today

Save $32.03 today

Download The Templates For $37 Just $4.95! Delivered instantly.
Start using them in the next 2 minutes.